Project
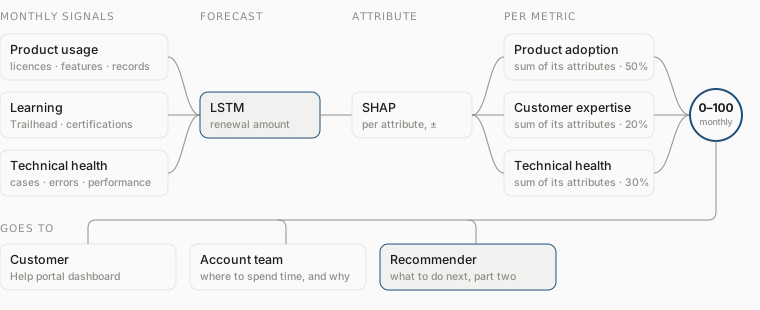
Usage → Success Score → Renewal Risk → Next Best Step
A health score for every Salesforce customer, a forecast of who renews, and a recommender for what each should do next.
01The question
Which customers are about to leave, and what should each of them do next?
Salesforce sells subscriptions, so renewal is the moment that matters. Every customer leaves a monthly trail of adoption, learning and technical health. Turn it into a forecast, a score, and a next step.
02Part one · Will they renew?
The score
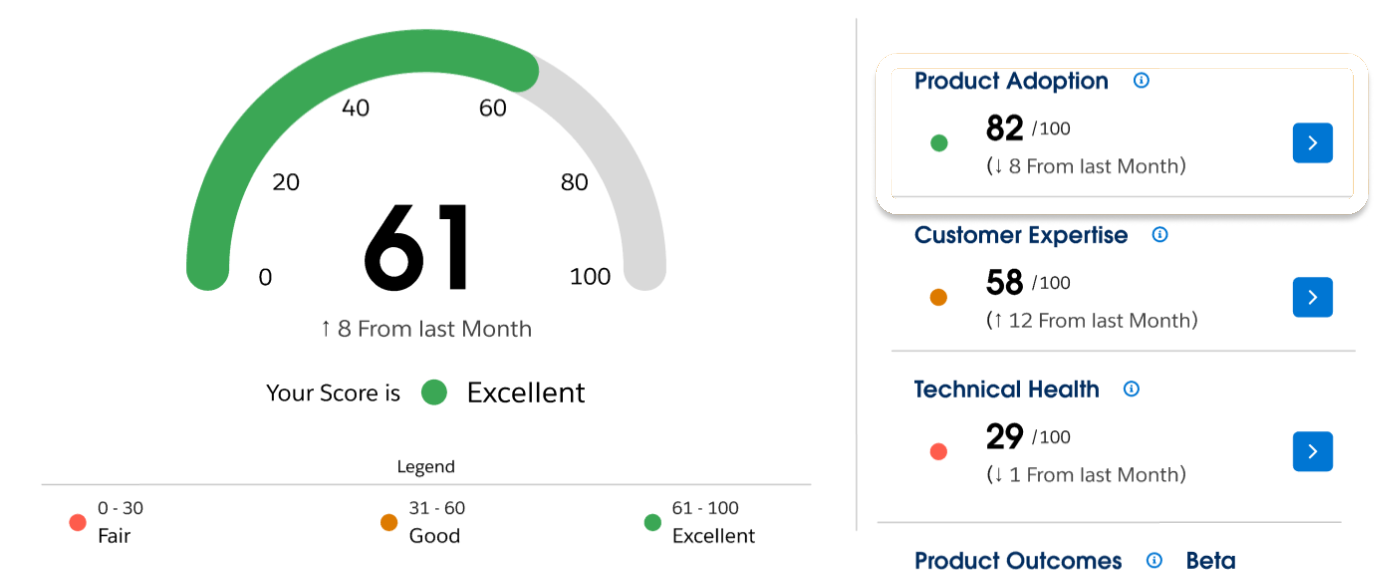
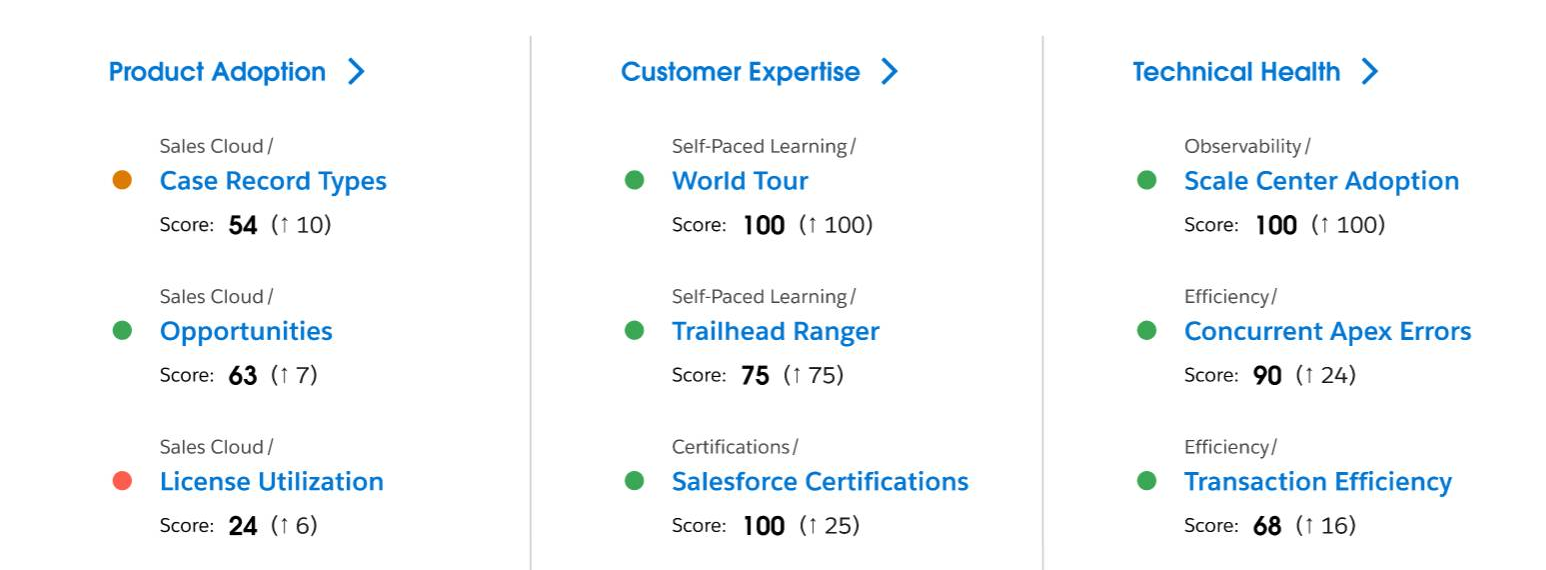
The Customer Success Score: one 0 to 100 number per customer, from product adoption, customer expertise and technical health, refreshed monthly. Customers see it in the Help portal; account teams plan around it. Winner of the 2023 TSIA STAR Award for Innovation in Customer Success.
The predictor
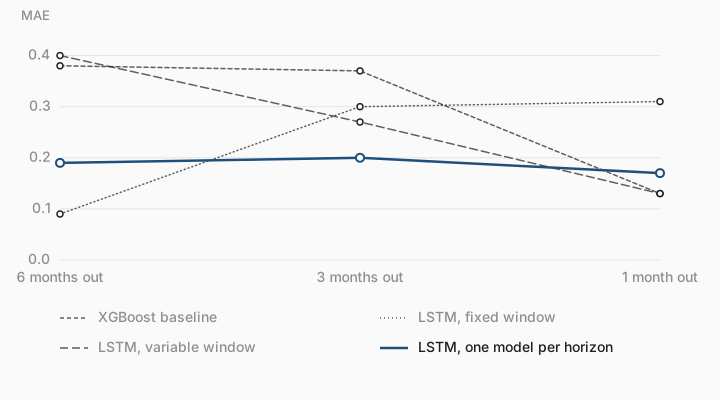
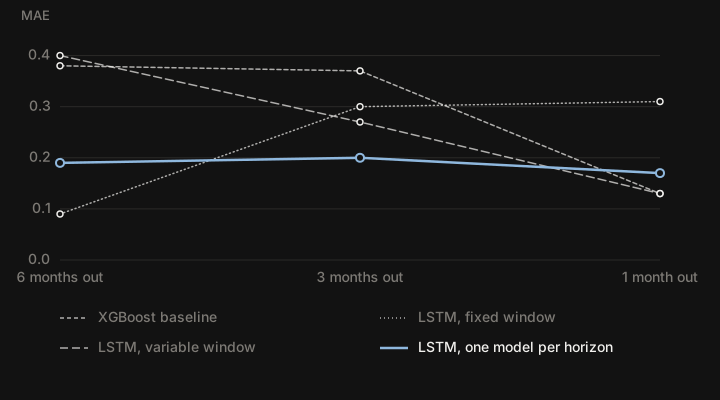
Renewals are seasonal and every history is a different length; a tabular model reading one month at a time misses the shape. A two-layer LSTM reads the whole sequence. Three iterations: a fixed six-month window (dropped 23 percent of opportunities), padded variable windows (dropped none), then one model per distance to renewal. The third held.
Results
| MAE on normalised renewal amount | 6 months out | 3 months out | 1 month out |
|---|---|---|---|
| XGBoost baseline | 0.38 | 0.37 | 0.13 |
| LSTM, one model per horizon | 0.19 | 0.20 | 0.17 |
From forecast to score
A forecast says how much, not why. SHAP gives every attribute its signed share of each prediction: renewal looks low because licence utilisation fell, despite strong certifications. Shares are summed into the metric each attribute belongs to, and those per-metric scores are product adoption, customer expertise and technical health. Causal analysis then separates the factors that move attrition from the ones that merely travel with it.
- forecast
- SHAP per attribute
- roll up per metric
- success score
In production
Seasonality lives in the model, so retraining dropped from monthly to twice a year. Retraining, scoring and attribution run end to end in Airflow.
03Part two · What should they do next?
The problem
A low adoption score says a customer is behind, not what to read. The first recommender was a classifier with one class per piece of content: new content meant retraining, and new customers got nothing.
Two towers
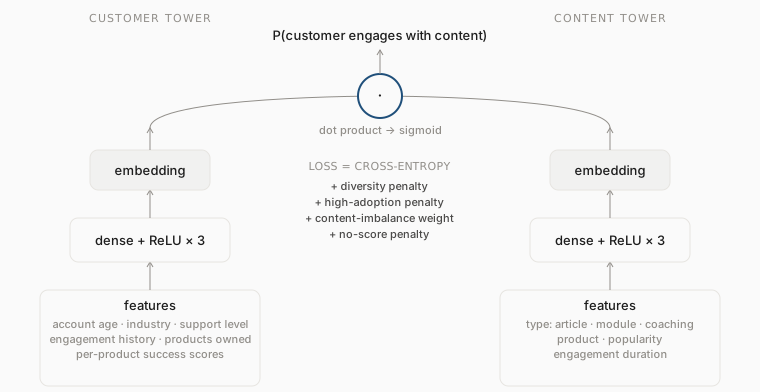
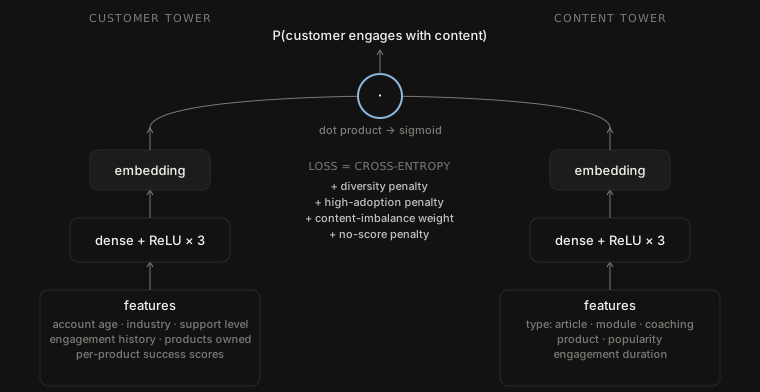
A two-tower model embeds customer and content in one space and scores a pair by dot product. New content needs an embedding, not a retrain; a new customer is placed by attributes alone.
Teaching it judgement
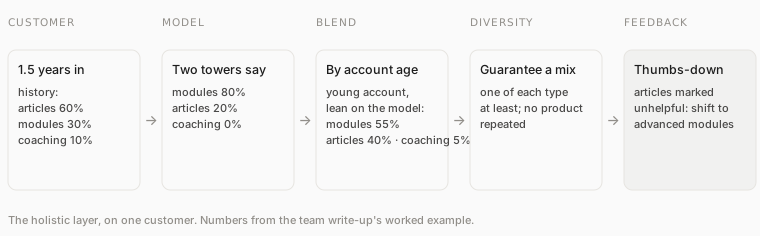
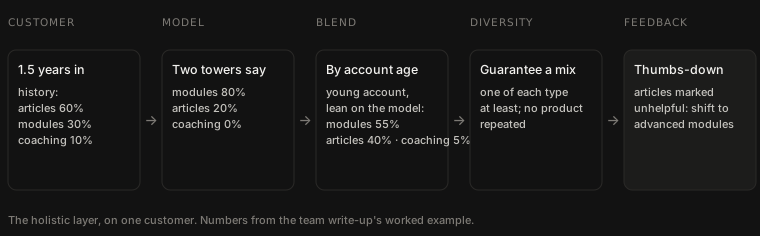
Plain cross-entropy recommends the popular thing to everyone. Four penalties fix that: repeating a product, pushing products already well adopted, starving rare content types, suggesting products the customer does not own. A holistic layer then blends model and history by account age and guarantees a mix.
Results
- +15 to 20%recall and precision vs the classifier
- +13%coverage
- +10%recall@20
- +6%diversity
04Impact
- $15M+revenue retained
- 97K+hours saved for account teams
- One number both sides see, a forecast that holds six months out, and the reasons behind it.
- A next step for every customer, including the ones with no history yet.
- A manual monthly refresh became a scheduled pipeline, retrained twice a year.
05Reading
- Salesforce HelpCustomer Success Score: overview ↗
- TrailheadHow the Customer Success Score is calculated ↗
- TSIA 2023STAR Award, Innovation in Customer Success ↗
- Medium 2025Personalized content at scale: how we built an AI-powered two-tower recommender (team write-up) ↗
- Google 2019Sampling-bias-corrected neural modeling for large corpus item recommendations ↗
- 1997Long short-term memory, Hochreiter and Schmidhuber ↗