← Anuja Saini

Project

Before → After → Which Buildings, How Badly

2019 to 2021

Grading building damage after a disaster from satellite image pairs.

01The question

After a hurricane, which buildings are gone, before anyone can drive there?

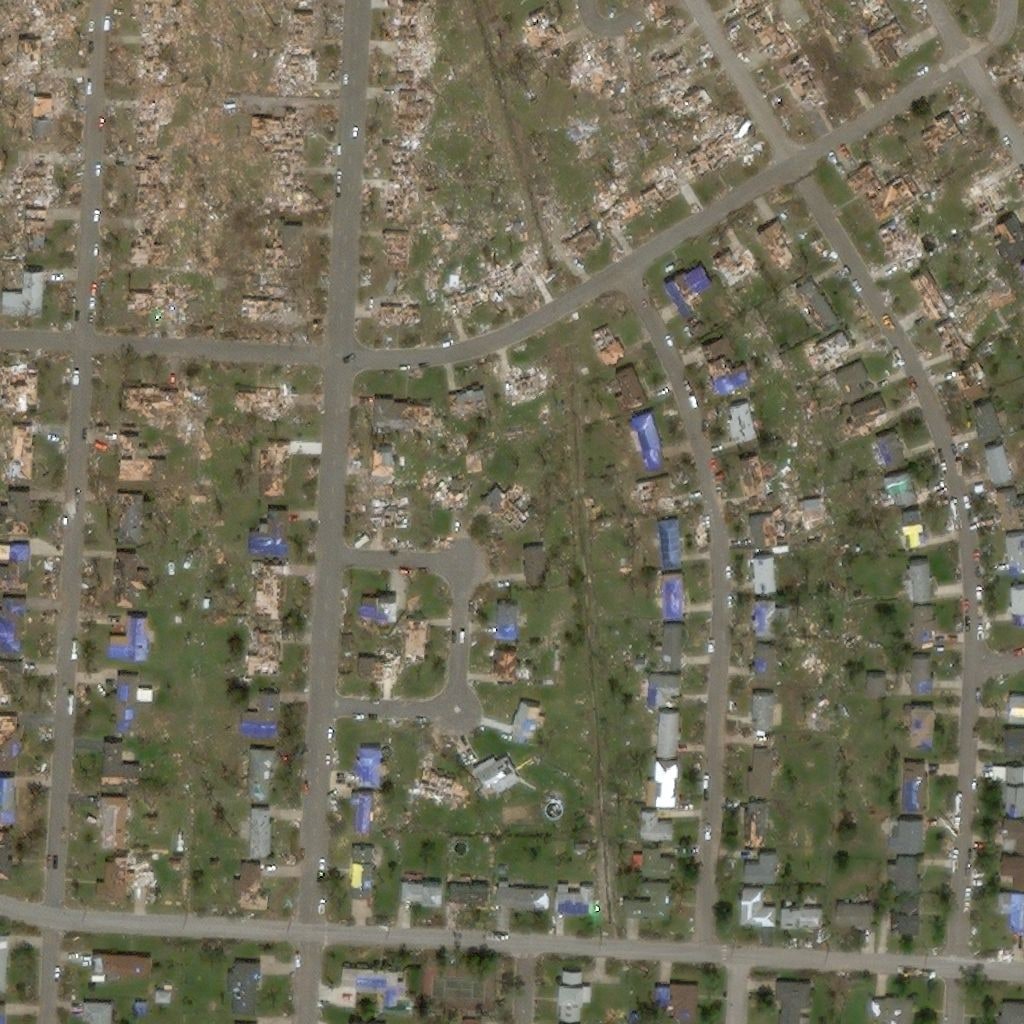
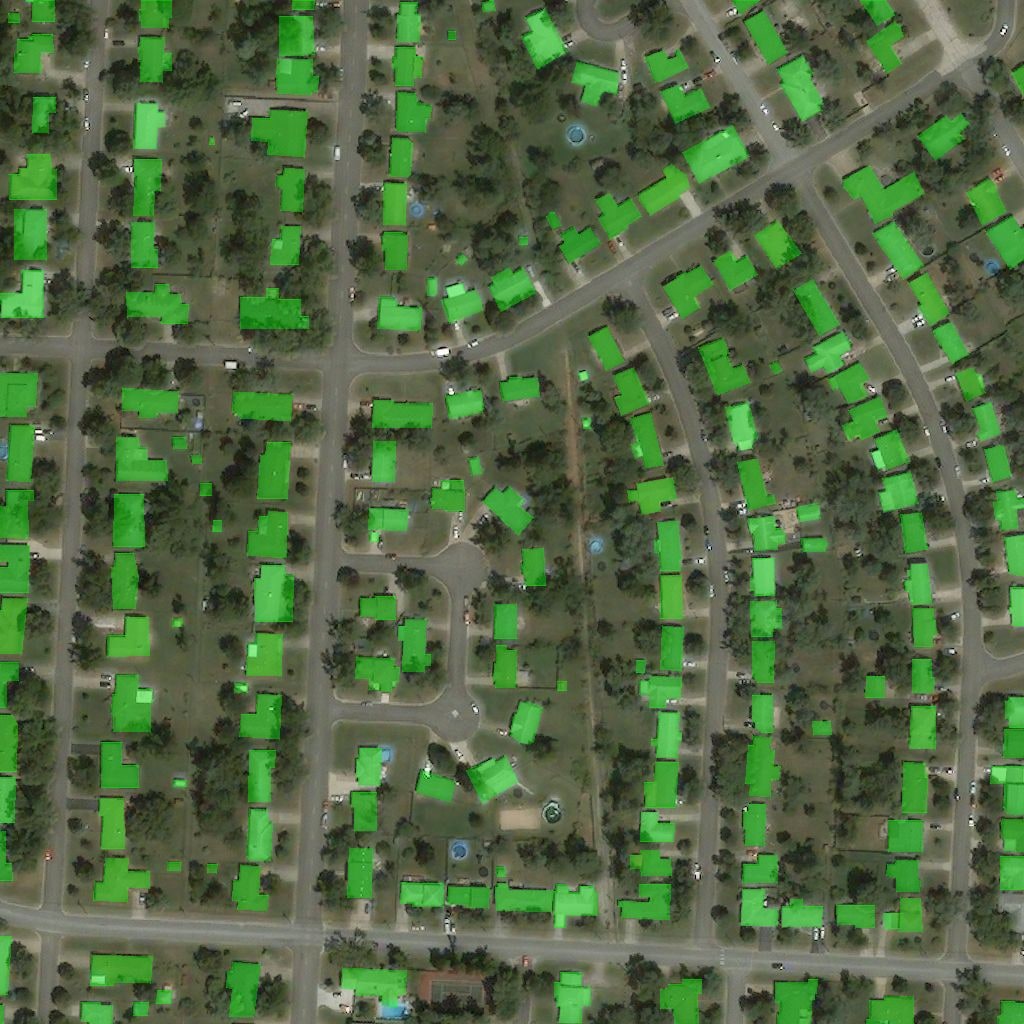
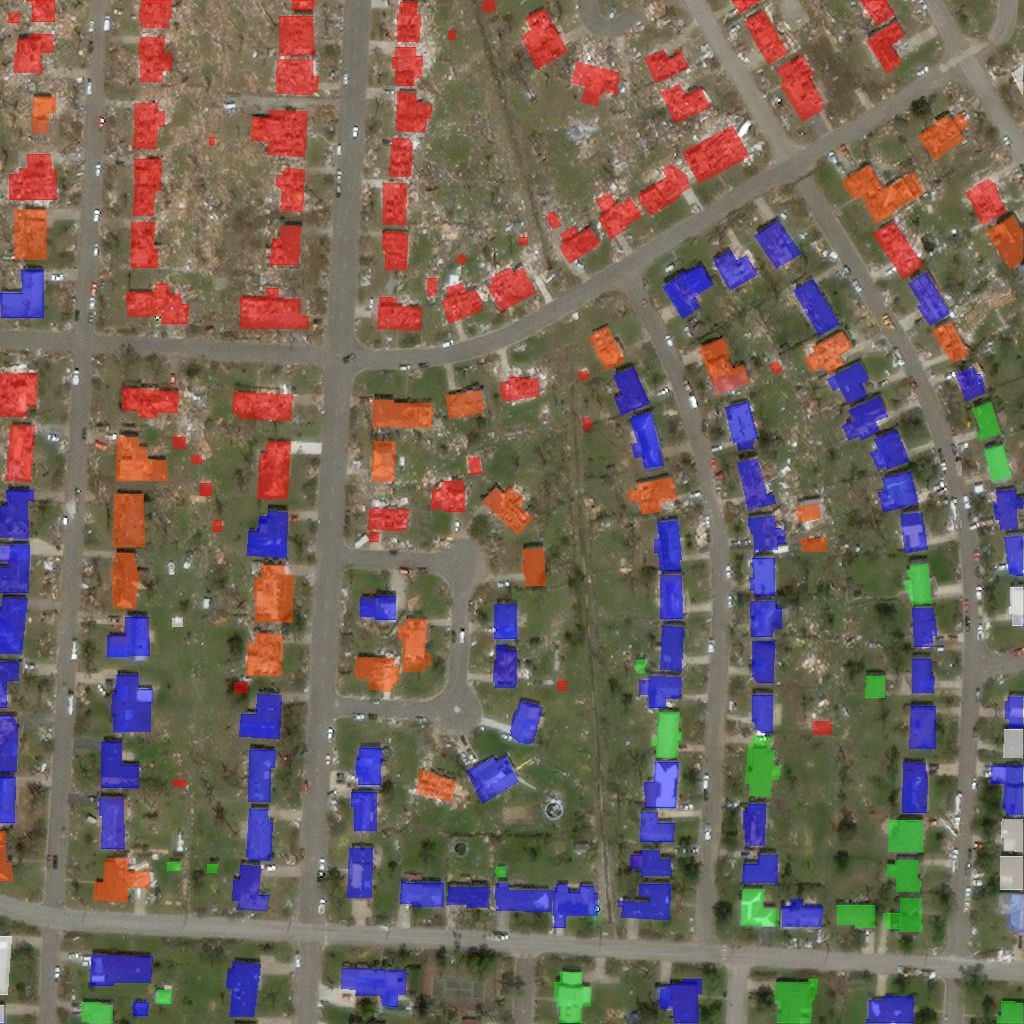
Two satellite images of the same streets, one before and one after. Find every building, then grade how badly each one was hit.
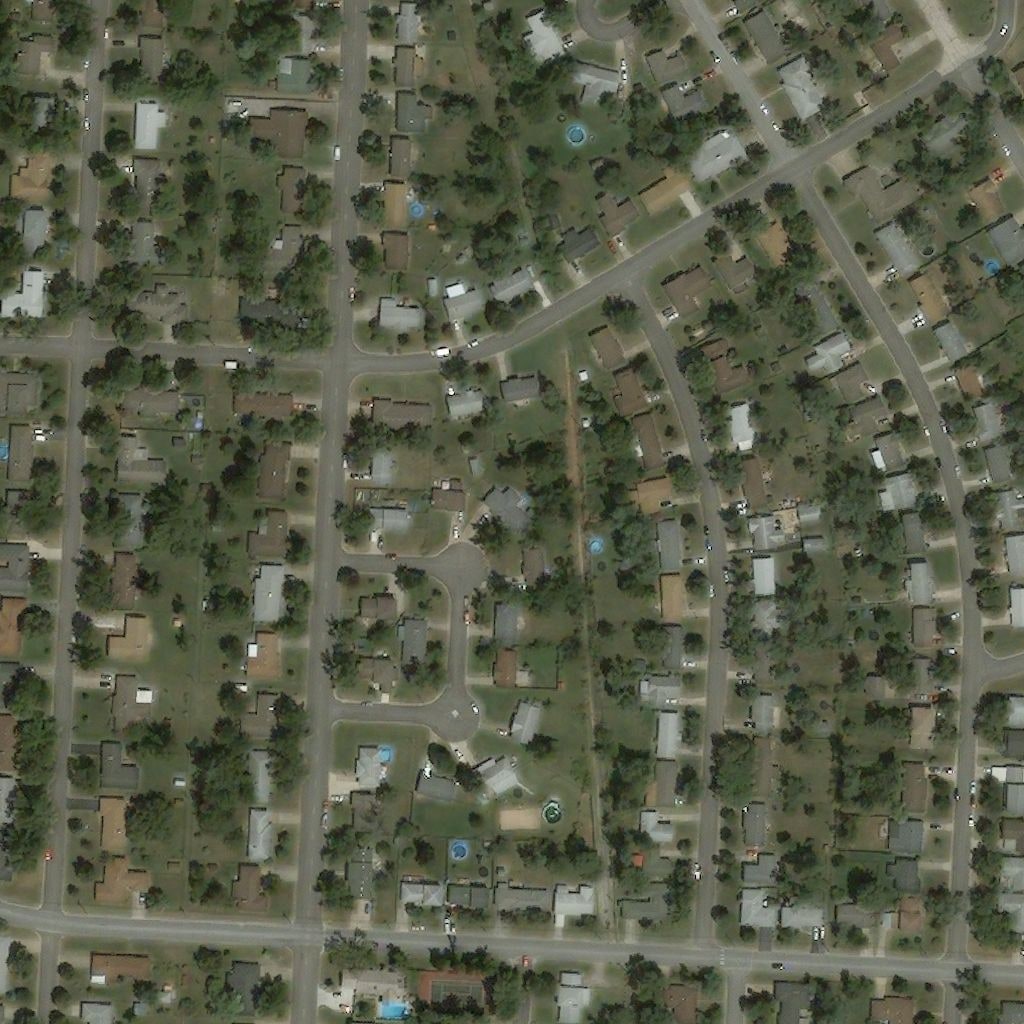
  • Satellite tile of a residential neighbourhood before a hurricanebefore
  • The same neighbourhood after the hurricane, many roofs goneafter
  • The before tile with every building footprint filled in greenbuildings found
  • The after tile with each building coloured by damage gradedamage graded
One tile, start to finish. Green none · blue minor · orange major · red destroyed.

02What it does

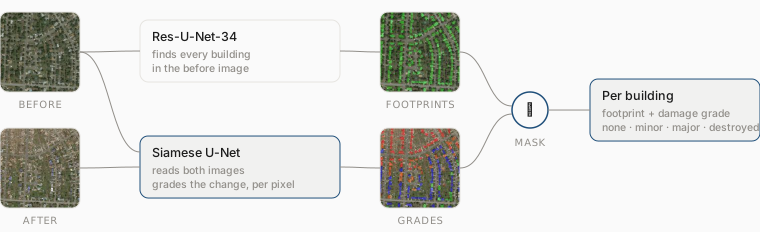
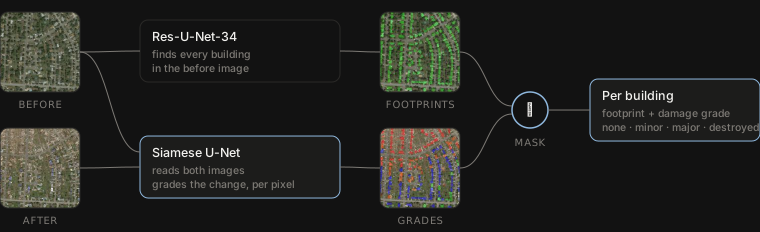
Pipeline: the pre-event tile goes to a Res-U-Net-34 that finds buildings; both tiles go to a Siamese U-Net that grades damage per pixel; the building mask keeps only grades where a building is, giving a footprint and grade per building.Pipeline: the pre-event tile goes to a Res-U-Net-34 that finds buildings; both tiles go to a Siamese U-Net that grades damage per pixel; the building mask keeps only grades where a building is, giving a footprint and grade per building.
Two models, one mask: the footprints keep only the grades that fall on a building.
Res-U-Net-34Siamese U-NetDice lossAdamW25.7M + 51.4M paramsPyTorch

03Results

  • 0.86F-score, finding buildings, held-out test
  • 0.76F-score, grading damage, held-out test
  • 850Klabelled building polygons trained on
xBD datasetxView2 challenge19 disasters · 15 countriessub-0.8 m imagery9,168 image pairs

Shipped as a web app

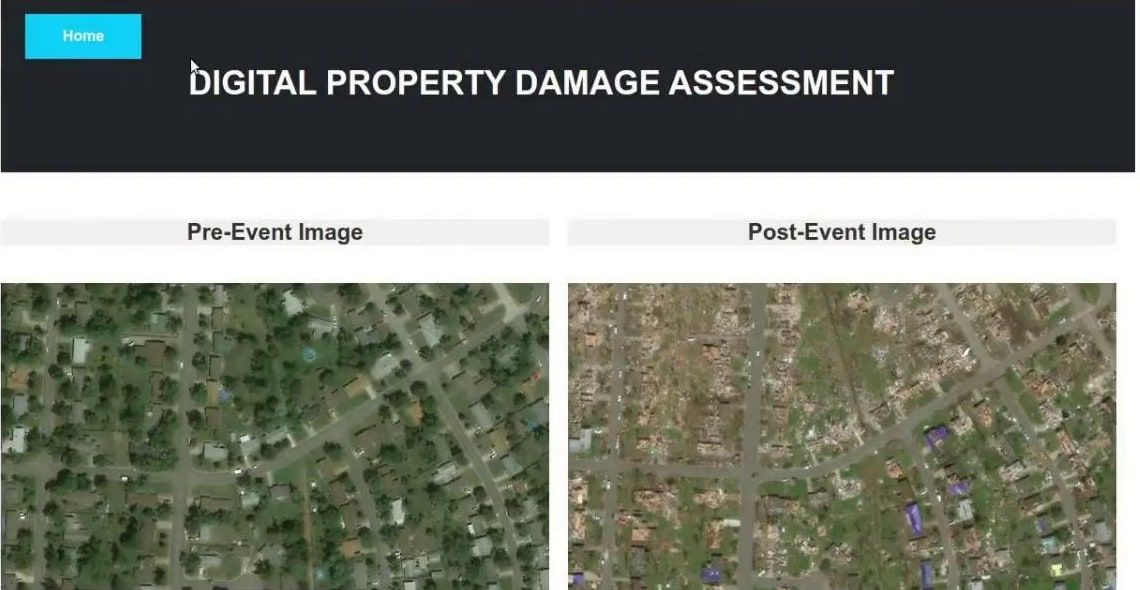
Upload a before and an after, get the graded map back. Two models on one GPU box behind a Flask endpoint, plain HTML in front.
AWS EC2 GPUFlaskHTML · CSS · JS
The web app: a dark header reading Digital Property Damage Assessment, with the pre-event and post-event images side by side
The app.

04What it led to

  • The practice’s first computer-vision delivery, and the start of everything on this page that reads the world from above.
  • Same shape as the LiDAR work five years later: find the asset, then measure what changed.

05Reading